Real Estate Infographics: 10 Topics Buyers and Sellers Save
Real estate infographics can make buyer and seller questions easier to answer. Use these 10 topics, source checks, and layout tips to plan your next post.
By Realtor Marketing Kit by Cosmo Suite · Editorial policy
Published · 9 min read
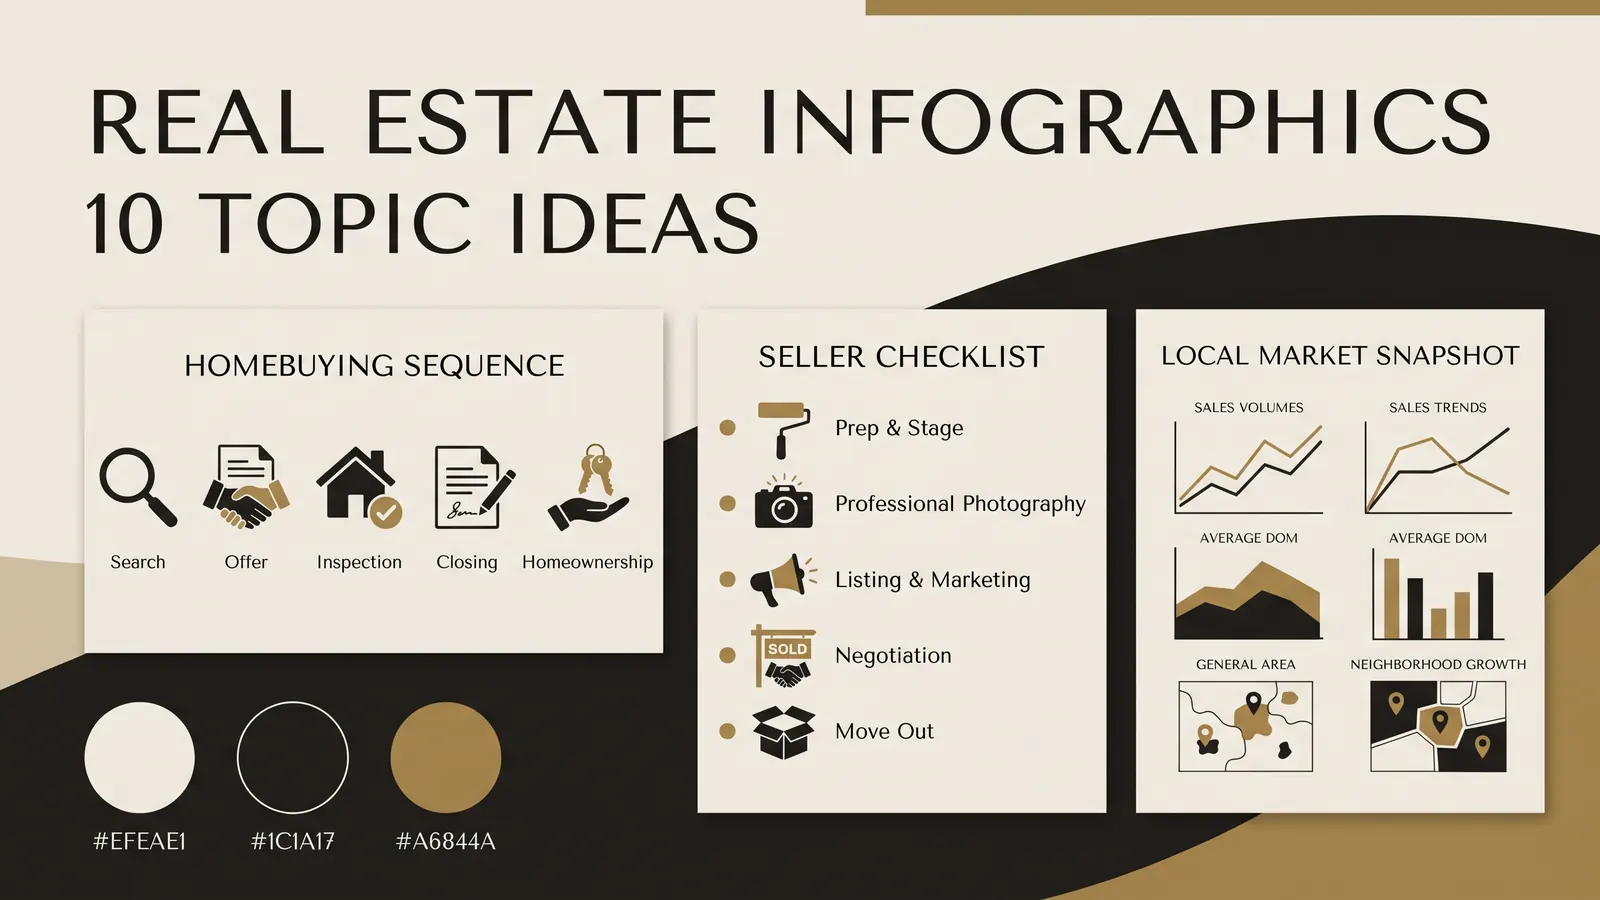
You have a useful answer for a buyer, but it takes five minutes to explain and a paragraph of small text to fit on a graphic. If the explanation needs tiny text, simplify the idea before you open Canva.
Real estate infographics work best when they answer one question, use a source the reader can check, and choose a visual structure that fits the answer. Below are ten topics for buyers and sellers, with a source to start from and a layout for each.
A real estate infographic is a graphic that uses concise text and visual structure to answer one housing question.
The Short Version
- Start with a real question from a buyer, seller, or homeowner in your market.
- Verify facts before choosing the design. A polished layout cannot correct an old or mismatched number.
- Use timelines for sequence, checklists for tasks, and comparisons for choices.
- Add the source, date, and market beside any data that can change.
- Treat a Canva template as a layout aid. You remain responsible for the content and brokerage review.
Start with one question, one source, and one visual
Begin with the reader's question. Put it in one sentence, find a source for the answer, then choose a layout that makes the answer easier to follow.
Starting with a template can force unrelated facts into the same graphic. A timeline needs events in order. A comparison needs a real choice with the same criteria on each side. A statistic card needs one current number with enough context to explain what it measures.
For example, "What happens after my offer is accepted?" can become a sequence. "What should I ask before I choose a lender?" may work better as a checklist. The larger map of real estate social media post types by listing stage can help you decide where an explainer fits alongside listing, open-house, and just-sold posts.
Ten real estate infographic ideas, matched to the question
These are starting prompts, not a promise that any format will earn saves or reach. Adapt them to the questions your clients ask and confirm local details before publishing.
| Topic | Reader question | Useful visual | First place to verify |
|---|---|---|---|
| 1. Buying a home | What happens from planning to closing? | A step-by-step path | CFPB homebuying resources |
| 2. Mortgage vocabulary | What do these loan terms mean? | Term and plain-language definition cards | CFPB consumer resources and lender documents |
| 3. Offer to closing | What comes after an accepted offer? | A dated timeline with conditional steps | Contract, lender, title, and local process |
| 4. Home inspection | What should I ask about during an inspection? | Room-by-room checklist | Inspector and state or local guidance |
| 5. Closing documents | Which papers should I expect to review? | Document checklist by stage | CFPB closing resources and transaction professionals |
| 6. Preparing for listing photos | What should I do before the photographer arrives? | Before-and-after task list | Photographer and seller instructions |
| 7. Getting ready for a showing | What can I finish before a buyer visits? | Short room-by-room checklist | Seller and agent plan |
| 8. Pricing a home | What factors go into a pricing conversation? | Factor map, not a price calculator | Current comparable sales and local MLS data |
| 9. Local market snapshot | What changed in my area this month? | One or two dated local figures | Local MLS or another named market source |
| 10. Moving and closing week | What should a household remember before and after closing? | Week-of checklist | Transaction timeline and household needs |
The Consumer Financial Protection Bureau's homebuying resource follows the reader from preparing to shop and exploring loan choices through selecting an offer and getting ready to close. That makes it a useful source for buyer-stage topics, but your own graphic should link to the specific CFPB resource that supports its claims. The CFPB's homebuying tools are a good starting point for that research.
Treat the source column as a research prompt, not a copy-and-paste instruction. A consumer agency may explain a general process, while your transaction documents and local professionals explain what applies to one buyer. For a mortgage-term graphic, define only the terms you can support with a current consumer source. For a closing timeline, label steps that can vary instead of drawing every buyer through the same sequence.
Use a format that fits the information
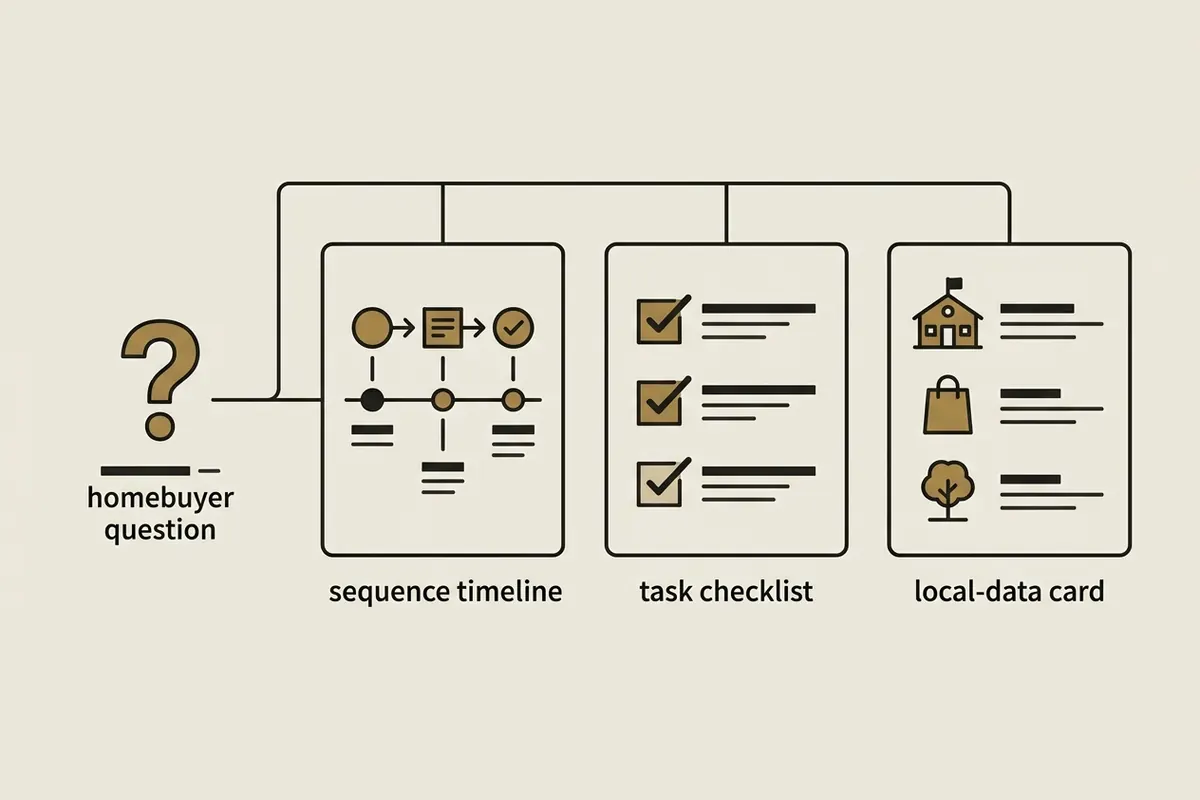
Choose the shape of the graphic after you know what kind of answer you have. A timeline explains order; a checklist supports a task; a comparison helps a reader evaluate options using the same criteria.
If the answer has several stages, let the reader move through them from left to right or top to bottom. If the answer is a set of independent reminders, group the reminders by room, document, or date. A comparison needs equivalent information in each column; otherwise the layout can make an uneven choice look settled. Keep the graphic to one main question and use the caption for supporting detail.
Use a timeline for a sequence. Keep each step short and label points where timing depends on the contract, lender, local practice, or another person. An accepted offer does not create the same schedule for every transaction, so do not present a sample timeline as a guaranteed deadline.
Use a checklist for preparation. Group tasks by place or time, such as "before the photographer arrives" or "the night before a showing." Keep the list focused. A graphic with thirty small tasks is a document, not a quick reference.
Use a comparison for choices. Put the same criteria in each column. A buyer comparing loan offers may need to look beyond a single monthly payment. Link to a trusted explanation instead of trying to compress every loan detail into a social post.
Use an annotated diagram for parts or steps. A diagram can label a closing document, a home feature, or a process. Label only details that are accurate and useful. Ask the relevant professional to review technical descriptions.
Use a single-number card sparingly. One number can be memorable, but only if the reader can see its source, date, geographic area, and definition. If those details need too much space, use a caption or a linked article to carry them.

The National Association of REALTORS® maintains an infographics collection that shows the range of real estate topics agents may explain visually. Use examples for inspiration, then create original text and artwork or confirm that you have permission to reuse a specific asset.
Make local data useful without making it misleading
Market numbers need a label that tells the reader what was counted, where, and when. "Prices are rising" is vague. A specific claim should name the metric, market area, source, and period, such as the month covered by a local MLS report.
Before you make a market infographic, write a source note in your working file. Include the report name, publication or retrieval date, the geography, and the measure. If the figure is a median sale price, do not call it an average. If you compare two periods, use the same data source and definition for both.
Avoid a forecast unless you can cite a qualified source and explain its limits. A current snapshot describes a period that has already happened. A prediction says something about the future. Those are different claims, even if they fit in the same chart.
If a national report does not describe your town, do not put a local label on it. If a statistic changes monthly, add a date where people can see it and revisit the post when you reuse it. A source line lets readers check a claim. A decorative "market facts" label does not.
Before publishing a local snapshot, decide whether the figure describes a month, a quarter, or a longer period. Keep that period visible in the image or its caption. If you compare months, use the same market boundary and the same measure in both periods. A chart with two series that use different geographies can suggest a change that the data never measured. If the source changes its definitions, explain the break or leave the comparison out.
Check the graphic before you publish it
Do a content pass before the design pass is finished. Check each statement against its source, then read the graphic as if the caption and comments were missing.
Test the graphic at the size people will see on a phone. Read the title, source note, and smallest label without zooming in. If a reader needs the caption to understand the main point, either bring that context into the image or simplify the claim. Alt text should name the subject and purpose of the visual; it does not need to repeat every word that already appears in the caption.
- Check the claim. Can you open the cited source and find the information? Does the date, market, and definition match your wording?
- Check the audience. Does the graphic describe a home or process, rather than suggesting who should or should not live in a neighborhood? HUD's fair-housing advertising regulations cover housing advertisements. Ask your broker about the rules that apply to your business and area.
- Check rights. Do not copy a photo, chart, illustration, or finished infographic just because it appears in a search result or social feed. The U.S. Copyright Office explains that copyright protects original expression, including writing, artwork, and photographs, but not facts or ideas themselves. That does not decide whether a particular reuse is allowed; get permission or use material you have rights to use.
- Check readability. View the image on a phone. If the source note or key step is too small, cut secondary details or split the idea into a short series.
- Check accessibility. Use strong contrast, plain labels, and alt text that explains the information conveyed by the image. Put essential details in the caption too, so they are not trapped in the graphic.
- Check brokerage requirements. Confirm firm identification, license details, listing permissions, and any required review with your broker before you publish.

Where Realtor Marketing Kit fits
Once the topic and facts are settled, a consistent layout can save you from starting every graphic at a blank canvas. Realtor Marketing Kit includes 100+ infographics among its 25 Canva template sets, plus posts, guides, and email materials for real estate agents. The templates open in a free Canva account; the kit does not verify research or market figures for you.
If you want an editable starting point for recurring buyer and seller explainers, Realtor Marketing Kit's Canva infographic templates can give you a design to adapt with your own source, wording, and brand colors. You still choose the topic, check the facts, and follow your brokerage rules.
The kit does not post or schedule content, provide local MLS data, or promise leads. It supplies editable designs. See the Realtor Marketing Kit templates if that is the part of your workflow you want to prepare in advance.
A planning card you can reuse
Before opening Canva, jot down five lines:
| Field | Your note |
|---|---|
| Reader question | What is the one thing this post will answer? |
| Audience | Buyer, seller, homeowner, or local resident? |
| Source and date | Which page or dataset supports each factual claim? |
| Visual form | Timeline, checklist, comparison, diagram, or number card? |
| Next step | What should the reader do or learn after the post? |
Keep this note with the draft. It gives you a quick way to check the final image against the question you meant to answer, especially when you reuse a layout for another topic.
Why Trust This Article
Realtor Marketing Kit by Cosmo Suite prepared the ten topic and visual pairings as original editorial suggestions for working real estate agents. We matched the layout to the kind of answer the reader needs: sequence, task list, comparison, or explanation. The source column names a place to verify each topic, not a claim that one source covers every local transaction. These recommendations are not a performance study and do not predict saves, reach, leads, or sales. Product details reflect Realtor Marketing Kit's published contents list, checked on 3 November 2026. Read our about page and editorial policy for more about the site.
Frequently asked questions
What should a real estate infographic include?
Start with one question from a buyer, seller, or local homeowner. Use a reliable source for factual claims, name its date and area when relevant, and choose a layout that makes the answer easy to scan. Add your brokerage details when required by your brokerage or local rules.
What topics work for real estate infographics?
Useful starting topics include the steps in buying a home, mortgage terms, an offer-to-closing timeline, inspection questions, showing preparation, listing photo preparation, and a dated local market snapshot. Match each topic to current information from an official or otherwise reliable source.
Where can an agent find reliable real estate statistics?
Use primary sources where possible, such as your local MLS for local market data, the CFPB for consumer mortgage resources, and NAR research for its published housing reports. Record the date, geography, and definition beside any figure you use.
Can I use a photo or meme I found online?
Do not assume that a public post is free to reuse. The U.S. Copyright Office says original photos and artwork can be protected. Use your own work, licensed material, or get permission, and ask your broker about business use.
Do real estate infographics need a source line?
A source line helps readers check a factual claim. Include the publisher, report or dataset name, date, and link where space allows. For local figures, also name the market and the period measured.
Can a Canva template verify market information?
No. A template helps arrange text and visuals. You still need to check each fact, date, location, and brokerage requirement before publishing.